My Story

From media planner in Paris to Chapter Lead in Amsterdam, I've spent a decade transforming how organizations use data to drive decisions. Managing 700+ BI users, processing 30M+ row datasets, building predictive AI systems, and creating data academies - here's my journey through enterprise BI, advanced analytics, and enablement at scale.

2022-Present

Chapter Lead – Business Intelligence

Mileway — Amsterdam

Lead BI platform strategy for 700+ users. Manage both developer and admin roles for Power BI/Tableau including governance, role-based access (Entra ID, RLS), and self-service enablement. Work with Data Warehouse team on SQL Server integration (~30 tables, largest 30M rows).

Power BI Tableau Microsoft Fabric PowerShell Power Automate Leadership
Key Achievements:
  • Created Data Academy: company-wide training with Coffee & Learn sessions, workshops, and Champions League competitions
  • Built Power BI Champions network with Teams channel supporting cross-department collaboration
  • Automated IAM workflows managing 4000+ users with PowerShell (Connect-MgGraph)
  • Developed Nomos AI: arrears prediction system with Fabric, ML Notebooks, and automated reminders
  • Extensive Confluence documentation with governance policies, guides, and best practices
2019-2022

Senior Business Analyst

CBRE — Slovakia

Transformed legacy Excel/Access processes into enterprise-scale BI solutions. Collaborated closely with Data Warehouse developers to integrate 30+ SQL Server tables into MicroStrategy and Tableau, handling datasets up to 30 million rows.

Key Achievements:
  • Led complete BI platform migrations from legacy systems to MicroStrategy, Tableau, and Alteryx
  • Designed and optimized ETL pipelines for processing 30M+ row datasets from SQL Server
  • Established data governance and best practices across multiple business units
  • Automated reporting workflows reducing manual processing time by 70%
MicroStrategy Tableau SQL Server Alteryx ETL
2017-2019

Junior Revenue Manager

Eurosport — Paris

Revenue operations with Power BI and OLAP cubes. First hands-on experience with modern BI platforms at scale.

Power BI OLAP SQL
2017-2019

MSc, Data Management

EFREI & PSB Paris

Deep dive into data engineering, business intelligence, and modern analytics platforms. Dual degree combining technical and business expertise.

Data Engineering BI Platforms Analytics
2015-2017

Media Planner

NRJ Group — Paris

Campaign analysis, audience reporting, and VBA/Excel dashboards. Where I discovered the power of data storytelling in media.

Excel VBA Analytics

Core Expertise

Visualization & BI

Power BI, Tableau, DAX, complex dashboards, data modeling

Cloud & Platform

Microsoft Fabric, Azure, Lakehouse architecture, Spark, data pipelines

Data Processing

SQL Server, Alteryx, Power Query, ETL, data transformation

Governance & Enablement

Role-based access (Entra ID, RLS), security policies, Confluence documentation, Champions network, training programs

AI & Automation

AI agents, Copilot Studio, Power Automate, n8n, intelligent reminders, email automation, predictive modeling (Nomos AI, Process Mining)

DevOps & Integration

Docker, Raspberry Pi hosting, Git, PowerShell, deployment pipelines, environment management (Dev/UAT/Prod), on-premise to cloud integration

From media planner in Paris to Chapter Lead in Amsterdam, I've spent a decade transforming how organizations use data to drive decisions. Managing 700+ BI users, processing 30M+ row datasets, building predictive AI systems, and creating data academies - here's my journey through enterprise BI, advanced analytics, and enablement at scale. Born in Provence, raised in Paris, worked across Europe. Now based in Amsterdam, where I combine my passion for data, technology, and empowering teams to unlock their analytical potential.
Projects

N8N Automation & Multi-Agent System

Exploring multi-agent automation with N8N, focusing on how different AI agents collaborate through webhooks and JSON workflows. Built a self-hosted Docker-based server with complete infrastructure management.

Technical Implementation:

  • Self-hosted Docker server with VPN configuration and backup automation
  • Agents exchange data and requests dynamically for collaborative workflows
  • Token optimization and advanced prompt design strategies
  • JavaScript-based logic for complex conditional routing and data transformation
  • PowerShell maintenance scripts for server management

Tech Stack: N8N, Docker, Webhooks, JavaScript, PowerShell, VPN, REST APIs

Learning: AI orchestration, workflow automation, containerization, and scalable automation architecture beyond BI

N8N Workflow

Smart Home Automation – Home Assistant

Built a comprehensive home automation system using Home Assistant, integrating multiple IoT devices and creating intelligent automation workflows for energy efficiency and convenience.

Key Features:

  • Automated lighting based on presence detection and time of day
  • Climate control optimization with temperature/humidity sensors
  • Energy monitoring and usage analytics dashboard
  • Voice control integration with Google Assistant
  • Custom automation scripts using YAML configurations

Tech Stack: Home Assistant, MQTT, ESPHome, Zigbee, Docker

Impact: 30% reduction in energy consumption, seamless smart home experience

Home Assistant Dashboard

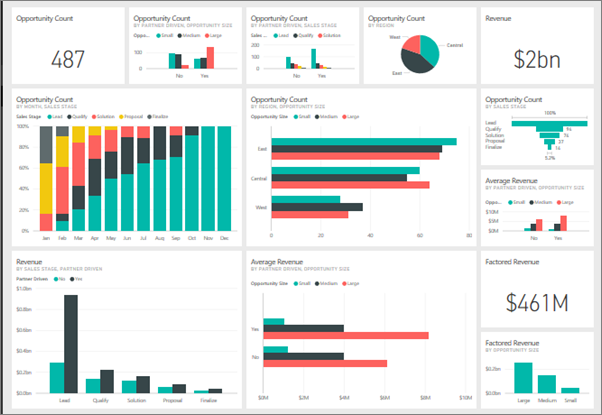
Data Academy – Company-Wide BI Training Program

Designed and launched a comprehensive data education platform at Mileway, transforming how 700+ users engage with BI tools and develop analytical skills.

Program Components:

  • Coffee & Learn: Weekly informal sessions covering Power BI tips, DAX best practices, and visualization techniques
  • Champions League: Quarterly BI competitions with real business challenges, fostering innovation and community engagement
  • Structured Workshops: Role-based training paths from beginner to advanced, covering the full BI stack
  • Champions Network: Built Teams channel connecting power users across departments for peer support

Impact: 80% user adoption rate, reduced support tickets by 40%, created self-service analytics culture

Power BI Dashboard

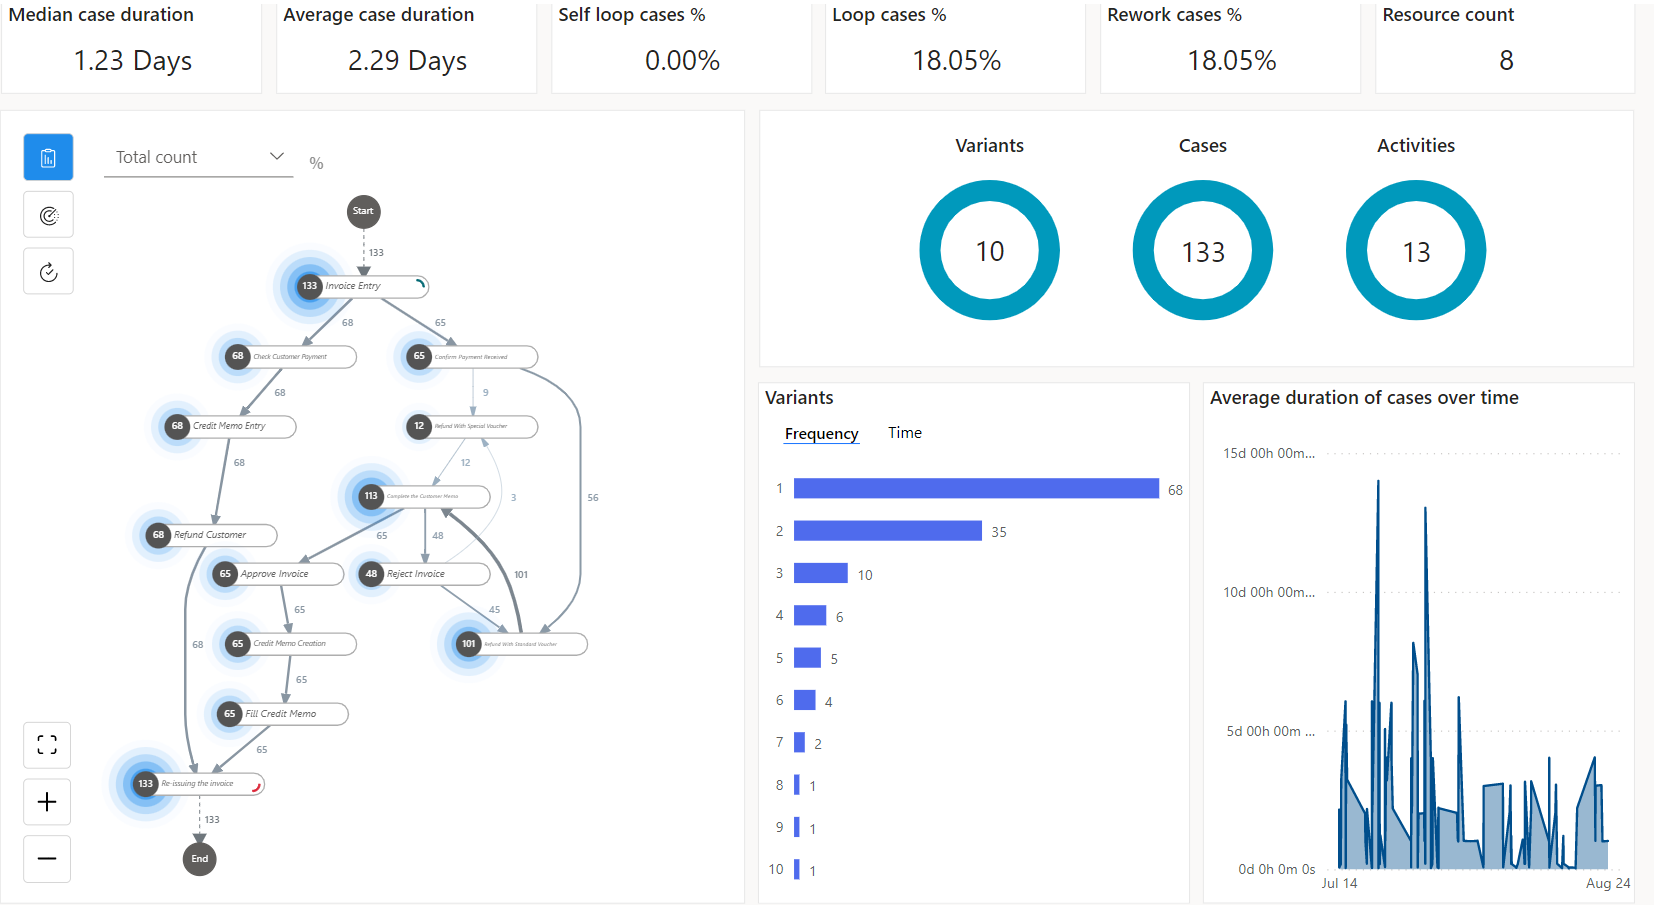
Process Mining – Power BI Usage Analytics

Developed process flow analysis to understand how users interact with Power BI reports, identifying bottlenecks and optimization opportunities.

Approach:

  • Analyzed user navigation patterns and report usage data
  • Created visual process flows showing common user journeys
  • Identified underutilized features and confusing report layouts
  • Generated actionable insights to improve UX and report adoption

Impact: Optimized report design, improved user engagement, reduced support tickets

Process Mining Dashboard

Sunrise Alarm Clock – MicroPython & Raspberry Pi

Built from scratch using a Raspberry Pi Pico W and MicroPython, this custom sunrise LED alarm simulates a natural sunrise, gradually brightening 30 minutes before the alarm rings for a calm, energy-efficient wake-up experience.

Learning Journey:

  • Pushed outside comfort zone into electronics, microcontrollers, and hardware programming
  • Handled everything from wiring to scripting without external support
  • Learned fast through experimentation and iteration
  • Plan to open-source the project and integrate with automation systems

Tech Stack: Raspberry Pi Pico W, MicroPython, WS2812B LED strips, GPIO

Demonstrates curiosity, resilience, and cross-disciplinary problem-solving

Raspberry Pi Pico W

Nomos AI – Predictive Collections Platform

Designed and built Nomos AI, a proof of concept transforming debt-collection operations through machine learning and AI agents within Microsoft Fabric. The system uses an XGBoost (XGB) model to predict collection outcomes and trigger automated reminders via connected agents.

End-to-End Development:

  • Connected data warehouse and modeled the dataset for ML training
  • Orchestrated AI flows and deployed them safely in Fabric
  • Balanced innovation with caution: gradual AI introduction, manual validation steps
  • Maintained stakeholder trust through constant communication

Role: Project lead and concept owner

Tech Stack: Microsoft Fabric, XGBoost, Power Automate, SQL Server, AI Agents

Impact: Reduced manual workload, faster reaction time on high-risk tenants, data-backed decisions

Power Automate Flow

BI Governance & Architecture Framework

Led the creation of the BI Governance and Architecture framework for 25 departments across 10 regions, ensuring each team could access data securely and consistently. Worked with multiple domains (Finance, Tax, Marketing, Treasury, IT) to define ownership, RLS models, and access controls.

Implementation:

  • Built Lucidchart diagrams and explainer videos visualizing data flow and role structure
  • Formed the base of the company's Data Academy initiative
  • Enhanced with UC-based charts allowing automatic updates when platform/process evolves
  • Bridged technical architecture with business understanding

Impact: Made BI governance transparent, reduced confusion between teams, built trust in the data platform

Tech Stack: Lucidchart, RLS modeling, video production, governance frameworks

Governance Framework

Power Apps Onboarding PoC

Developed a proof of concept onboarding application in Power Apps to simplify and standardize the employee onboarding process. New joiners struggled to locate SharePoint links, internal tools, and configuration steps.

Solution Design:

  • Guided workflow for each task: setting up access, uploading profile photo, completing mandatory steps
  • Clear and user-friendly interface built on Microsoft's templates
  • Customized workflow and design aligned with company needs
  • Manager visibility dashboard for completion tracking

Goal: Improve consistency, reduce delays, give managers visibility

Remained a PoC for political reasons, but technical and functional success demonstrated how low-code tools can improve employee experience and translate operational pain points into digital solutions

Power Apps Screenshot

Interactive Tableau CV

Designed an interactive CV dashboard in Tableau to turn professional experience into visual, dynamic data. Using Excel and Google Sheets as data sources, I built an automated system where each new experience or skill update appears instantly on the dashboard.

Technical Implementation:

  • Calculated fields, timelines, and responsive layouts
  • Automated data refresh from Google Sheets for real-time updates
  • Coherent narrative balancing design and data accuracy
  • Data storytelling to make information engaging and understandable

Impact: Shared on LinkedIn and used in workshops, inspiring others to rethink self-presentation using their own data to tell a story of growth and impact

View CV

Tableau Course with Éditions ENI

Created a beginner-friendly Tableau course for Éditions ENI, one of France's major IT learning publishers. Designed the full learning path — from the first contact with data in Excel to publishing interactive dashboards on Tableau Server and Tableau Public.

Course Development:

  • Recorded step-by-step video lessons in the studio explaining key BI concepts
  • Designed practical exercises and best practices for building first dashboards
  • One of the few comprehensive French-language Tableau courses at the time
  • Structured complete learning journey making complex analytical concepts approachable

Impact: Combining storytelling with pedagogy — skills that still influence how I train and support BI users today

View Course
Tableau Book Cover

Awards & Recognition

Dutch Interactive Award 2023

Participated in the Dutch Interactive Award 2023 for the Data Academy initiative - recognition for innovative approach to enterprise-wide BI education and user enablement.

Dutch Interactive Award 2023

Mileway AI Challenge Winner

Won the company-wide AI Challenge - demonstrating innovative application of AI and automation to solve real business problems.

AI Challenge Winner View on LinkedIn →